Technical Data of the Accu-Chek SmartGuide Device
Product Name
Accu-Chek SmartGuide device
Operating Principle
The device comprises an applicator and a sensor. While the applicator is discarded after the application of the sensor, the sensor remains on the user's skin with the electrochemical sensor inserted in the user's subcutaneous tissue. The sensor is discarded after the end of its wear time.
To calibrate the sensor, a glucose value is taken from a blood glucose meter, entered into the app, and sent to the sensor. To monitor glucose levels continuously, interstitial fluid glucose data are sent by the sensor every 5 minutes to the app. The app runs on a mobile device.
Product Dimensions
Height (incl. adhesive pad) | 5.9 mm |
Needle length | 8.2 mm |
Diameter of sensor without adhesive pad | 33.3 mm |
Weight | 5 g |
Data Transfer
The sensor transfers the following data to the app:
- Serial number
- Firmware version
- Hardware version
- Sensor information (System ID / MAC address)
- Time for next calibration
- CGM values
- Status information
CGM values generated while the sensor is in Trend Mode are indicated by the Sensor Status Annunciation-Bit 'Calibration required'.
The sensor receives the following data from the app:
- Blood glucose value for calibration
- CGM session start time
Radio Frequency
Purpose of interface | Communication interface. Allows the sensor to exchange data with a mobile device. |
Interface specification | Bluetooth Low Energy 5.0 or higher |
Frequency band of radio frequency reception and transmission | Frequency band of BLE 5.0: 2.402–2.480 GHz |
Type and frequency characteristics of the modulation | GFSK (Gaussian Frequency-Shift Keying) |
Effective radiated power of transmission | Less than 10 mW |
Method of time synchronization | The sensor synchronizes according to the synchronization intervals of the mobile device. |
Range of Bluetooth Low Energy | 6 m |
Access to Bluetooth Low Energy connection with mobile device | On the mobile device, Bluetooth Low Energy must be turned on for establishing a connection. |
Radio frequency interferences | Communication may be affected by other radio frequency devices. |
Electromagnetic Compatibility (EMC)
All EMC tests were carried out in accordance with the IEC 60601-1-2:2014, IEC 60601-1-2:2014/AMD1:2020 standards.
Electromagnetic fields and electromagnetic radiation may interfere with the proper operation of the sensor, resulting in incorrect CGM values. The sensor can influence other equipment (for example, through transmitted Bluetooth signals) if it is used outside its technical specifications. Only use the sensor within its technical specifications.
Don't place other devices close to or on top of the sensor. Use of the sensor alongside or with other devices may result in incorrect operation. If such use is necessary, observe the sensor and the other devices. Verify that the sensor and other devices are operating as intended.
Don't bring portable radio frequency communication devices (including peripherals such as antenna cables and external antennas) closer than 30 cm (12 inches) to the sensor. This may affect the performance of the sensor.
Electromagnetic Emissions
The sensor complies with the following Emissions Standards.
Radiated RF emission according to:
- CISPR 11 (EN 55011) class B, group 1
- RTCA DO160G Section 21, category M for in-cabin use
Electromagnetic Immunity
The sensor complies with the following Immunity Standards and Immunity Test Levels.
Electrostatic discharge (IEC 61000-4-2), Test Level:
- Contact: ± 2 kV, ± 4 kV, ± 6 kV, ± 8 kV
- Air: ± 2 kV, ± 4 kV, ± 8 kV, ± 15 kV
Radiated RF Electromagnetic fields (IEC 61000-4-3), Test Level:
- 10 V/m, 80 MHz–2,7 GHz, 80 % AM at 1 kHz
Proximity fields from RF wireless communications equipment (IEC 60601-1-2 Table 9), Test Level:
Test Frequency | Band a) | Service a) | Modulation | IMMUNITY TEST LEVEL |
|---|---|---|---|---|
385 | 380 to 390 | TETRA 400 | Pulse modulation b) | 27 |
450 | 430 to 470 | GMRS 460, FRS 460 | FM c) | 28 |
710 | 704 to 787 | LTE Band 13, 17 | Pulse modulation b) | 9 |
745 | ||||
780 | ||||
810 | 800 to 960 | GSM 800/900, TETRA 800, iDEN 820, CDMA 850, LTE Band 5 | Pulse modulation b) | 28 |
870 | ||||
930 | ||||
1 720 | 1 700 to 1 990 | GSM 1800; CDMA 1900; GSM 1900; DECT; LTE Band 1, 3, 4, 25; UMTS | Pulse modulation b) | 28 |
1 845 | ||||
1 970 | ||||
2 450 | 2 400 to 2 570 | Bluetooth, WLAN, 802.11 b/g/n, RFID 2450, LTE Band 7 | Pulse modulation b) | 28 |
5 240 | 5 100 to 5 800 | WLAN 802.11 a/n | Pulse modulation b) | 9 |
5 500 | ||||
5 785 | ||||
If necessary to achieve the IMMUNITY TEST LEVEL, the distance between the transmitting antenna and the ME EQUIPMENT or ME SYSTEM may be reduced to 1 m. The 1 m test distance is permitted by IEC 61000-4-3. | ||||
a) For some services, only the uplink frequencies are included. b) The carrier shall be modulated using a 50 % duty cycle square wave signal. c) As an alternative to FM modulation, the carrier may be pulse modulated using a 50 % duty cycle square wave signal at 18 Hz. While it doesn't represent actual modulation, it would be worst case. | ||||
Rated power frequency magnetic fields (IEC 61000-4-8), Test Level:
- 30 A/m, 50 Hz
- 30 A/m, 60 Hz
Proximity magnetic fields (IEC 61000-4-39), Test Level:
- 8 A/m, 30 kHz, CW modulation
- 65 A/m, 134.2 kHz, pulse modulated, duty cycle 50 %, 2.1 kHz Repetition rate
- 7.5 A/m, 13.56 MHz, pulse modulated, duty cycle 50 %, 50 kHz Repetition rate
Protection Against Electrical Shock
Electronic device of type BF according to the standard IEC 60601-1. Protection against electrical shock.
Protection Against Ingress of Fluids
IP28: The sensor is protected against the effects of temporary immersion in water at a depth of 1 meter for up to 60 minutes.
Method of Sterilization
Radiation
Interfering Substances
Taking the following interfering substances while wearing the sensor may falsely raise CGM values displayed in the app:
- Ascorbic Acid (vitamin C): more than 500 mg / day orally, or any amount intravenously
- Supplements with Gentisic Acid
- Methyldopa
Falsely raised CGM values can lead to insulin overdosing and/or could cause you to miss an occurrence of very low glucose. If you are taking any of the listed interfering substances, consult with your healthcare professional.
Environmental Conditions
Transport and storage conditions of the sensor in its unopened packaging:
- Temperature range: 2 to 27 °C
- Humidity range: 10 to 90 % (non-condensing)
- Air pressure range: 549 to 1,060 hPa
Make sure that you only store unopened products. Insert the sensor immediately after opening the packaging.
Operating conditions of the sensor:
- Temperature range: 10 to 40 °C
- Humidity range: 15 to 90 % (non-condensing, water vapor partial pressure less than 50 hPa)
- Air pressure range: 700 to 1,060 hPa
- Maximum altitude: 3,000 m (9,842 ft)
The time to warm up the CGM device from lowest storage temperature (2 °C) to lowest operating temperature (10 °C) is less than 17 minutes.
The surface temperature of the sensor will remain below 43 °C and will only exceed 41 °C for a limited time.
Performance Data
Consult your healthcare professional to discuss the use of the following data.
The performance of the Accu-Chek SmartGuide sensor was evaluated in a controlled clinical trial (data on file). The study was conducted in 3 clinical centers and included 48 people with Type 1 or insulin-dependent Type 2 diabetes (18 years and older). Each study participant was wearing three sensors over 14 days on the back of the upper arms. During the study, sampling days with glucose manipulations were conducted, where capillary glucose measurements were taken as comparison values. In the study, three sensor batches were investigated.
Figure 1: Regression analysis of sensor values in comparison to capillary measurements
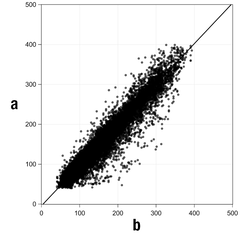
Table 1: Regression analysis
Slope | 1.02 |
Axis intercept | -4.2 mg/dL (-0.2 mmol/L) |
Correlation (Pearson’s r) | 0.96 |
N | 15993 |
Range | 40-400 mg/dL (2.2-22.2 mmol/L) |
Overall MARD | 9.2 % |
Table 2: Sensor performance compared to capillary measurements at different glucose ranges
Glucose | Overall MAD/MARD* |
|---|---|
< 54 mg/dL (3.0 mmol/L) | 7.5 mg/dL (0.42 mmol/L)* |
54-69 mg/dL (3.0-3.8 mmol/L) | 7.0 mg/dL (0.39 mmol/L)* |
70-180 mg/dL (3.9-10.0 mmol/L) | 9.8 % |
> 180-250 mg/dL (10.0-13.9 mmol/L) | 8.0 % |
> 250-350 mg/dL (13.9-19.4 mmol/L) | 7.3 % |
> 350 mg/dL (19.4 mmol/L) | 4.9 % |
* For glucose < 70 mg/dL (3.9 mmol/L), the differences in mg/dL (mmol/L) are presented instead of relative differences (%). | |
MARD (Mean Absolute Relative Deviation) is the mean of the absolute relative deviations of the CGM values from the simultaneously measured blood glucose values. MARD is determined as follows:
- The simultaneously measured blood glucose value is subtracted from the continuous glucose value. The absolute amount of the difference is put into percentage relation to the blood glucose value. The percentages of all pairs of values are added together and the result divided by the number of pairs of values (n).
MAD (Mean Absolute Deviation) is the mean of the absolute deviations of the CGM values from the simultaneously measured blood glucose values. MAD is determined as follows:
- The simultaneously measured blood glucose value is subtracted from the continuous glucose value and the absolute amount of the difference is taken. The amounts of all pairs of values are added together and the result divided by the number of pairs of values (n).
Table 3: Sensor performance compared to capillary measurements over sensor wear time
Beginning | Middle | End | |
|---|---|---|---|
Overall MARD | 8.3 % | 9.0 % | 10.8 % |
Table 4: Sensor performance according to agreement rates
Total number of pairs | Within ±15 mg/dL (±0.8 mmol/L) and ±15 % of the capillary measurements | Within ±20 mg/dL (±1.1 mmol/L) and ±20 % of the capillary measurements | Within ±30 mg/dL (±1.7 mmol/L) and ±30 % of the capillary measurements | Within ±40 mg/dL (±2.2 mmol/L) and ±40 % of the capillary measurements | |
Sensor performance overall | 15993 | 13345 (83.4 %) | 14471 (90.5 %) | 15510 (97.0 %) | 15803 (98.8 %) |
Sensor performance < 70 mg/dL (3.9 mmol/L) | 1121 | 998 (89.0 %) | 1057 (94.3 %) | 1112 (99.2 %) | 1118 (99.7 %) |
Sensor performance 70 - 180 mg/dL (3.9 - 10.0 mmol/L) | 9793 | 7923 (80.9 %) | 8718 (89.0 %) | 9444 (96.4 %) | 9660 (98.6 %) |
Sensor performance > 180 mg/dL (10.0 mmol/L) | 5079 | 4424 (87.1 %) | 4696 (92.5 %) | 4954 (97.5 %) | 5025 (98.9 %) |
Note that all performance data shown represents data from sensors in Therapy Mode. In the study described, sensors in Trend Mode showed an overall MARD of 10.2 %. Insulin dosing decisions are only possible in Therapy Mode. For more information, see chapter Calibrating Your Sensor.
Adverse Events
No serious adverse events, or device-related serious adverse events, occurred during the study. There were a total of 35 adverse events which occurred during the study. Of these, 15 were related, or possibly related, to the device. All of these 15 adverse events were related to reactions at the application site, such as short bleeding, pain, hematoma, erythema, mild inflammation, or pruritus.