Statistics
The Statistics report gives a quick overview of key indicators involving your therapy and glucose values over the last 7, 14, or 28 days.
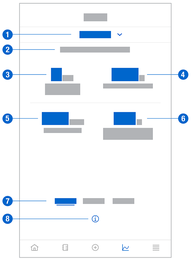
- Indicates Statistics graph is displayed; tap to select a different graph.
- Selected time range
- Number of calendar days you have worn your sensor
- Percentage of time you have worn your sensor and it has been active, within the selected time range
- Average glucose value over the number of days your sensor has been active within the selected time range
- Glucose management indicator (GMI); the GMI is calculated from your average glucose and estimates your HbA1c for the selected time period.
- Select 7, 14, or 28-day view.
- Tap to see more information on the Statistics graph.
To view your Statistics, proceed as follows:
- Tap Graphs.
- Select Statistics from the drop-down menu.
- The Statistics screen is displayed.
- Tap the time range you want the statistics to represent.
- 7 Days
- 14 Days
- 28 Days